
1. About this exercise
- GIS expertise: intermediate
- Duration : 3 hours
- GIS software: checked on QGIS 3.34 (LTR)
- Last update: September 2024
- Author : Romain Armand
2. Context and definitions
Urban sprawl refers to the expansion of urbanization (in French: artificialisation). This process involves:
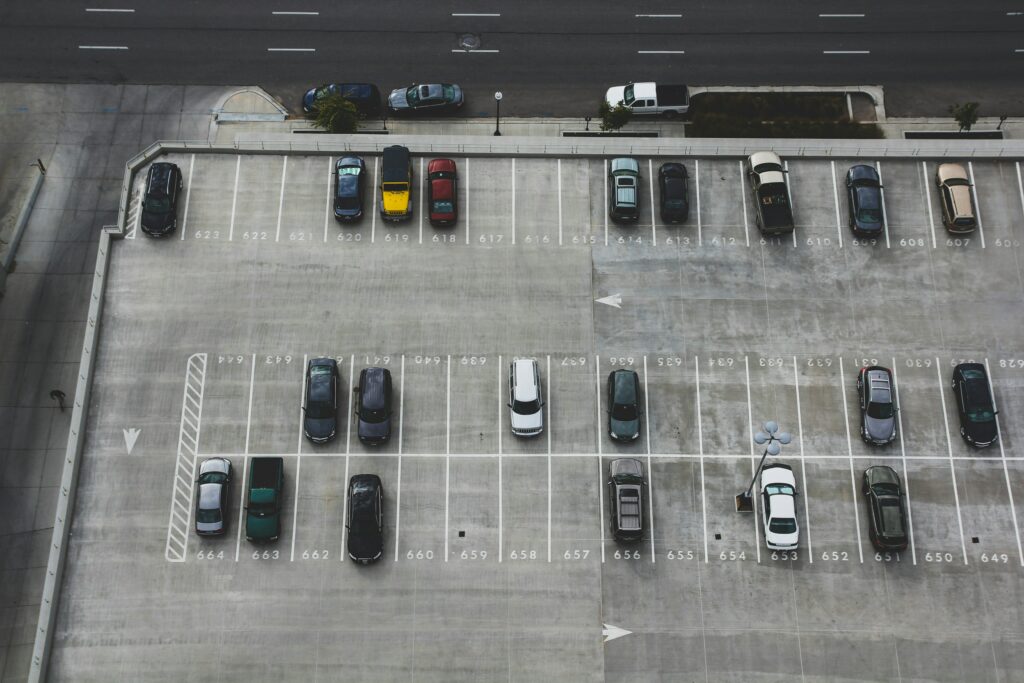
- Soil sealing due to the construction of impervious areas (roads, buildings, parking lots) which increase runoff generation,
- Loss of fertile farmland,
- Loss of ecological soil functions,
- Loss of wildlife habitats.
Extended materials for the European Union may be found in this report of the European Environmental Agency.
Metropolitan area corresponds to a major city together with its suburbs and nearby cities, towns, and environs (Britannica.com). In French : aire urbaine ou intercommunalité.
3. Instructions
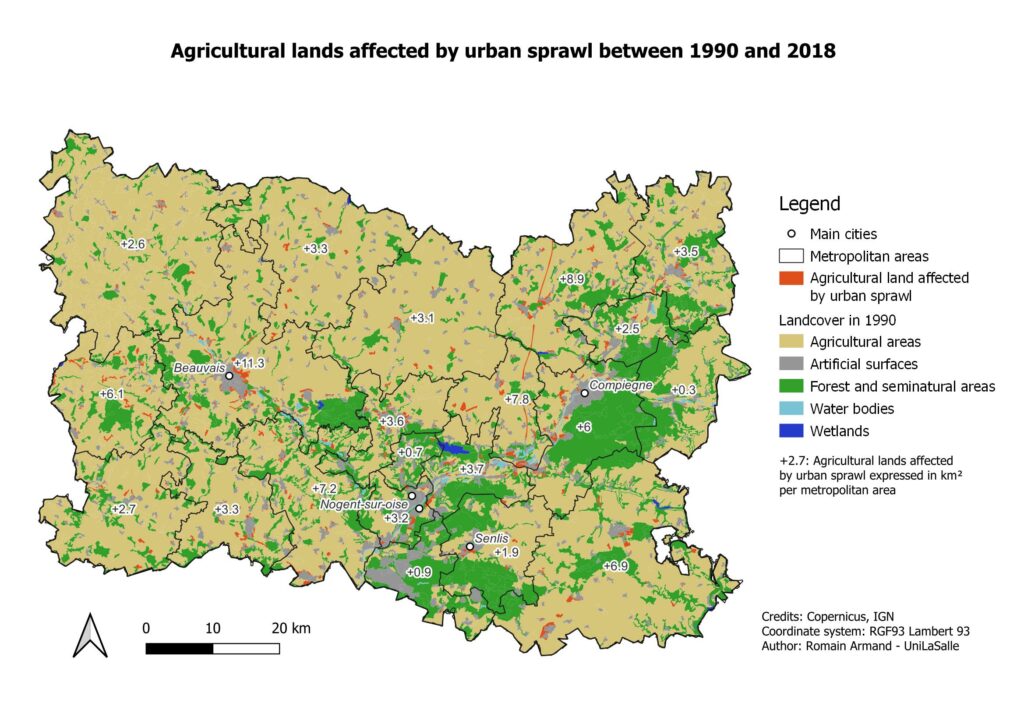
Within the Oise district, you are asked to map the agricultural lands in 1990 which have been converted into artificial areas until 2018. This process will be named ‘urban sprawl’ in the following parts.
This map should display:
- the agricultural lands which have been affected by urban sprawl,
- the area (expressed in km²) of urban sprawl per metropolitan areas,
- 1990 land cover as basemap,
- the usual map layout (scale bar, North arrow, etc.).
Calculate (in km²):
- the whole area affected by the urban sprawl,
- the area affected by the urban sprawl for each metropolitan area,
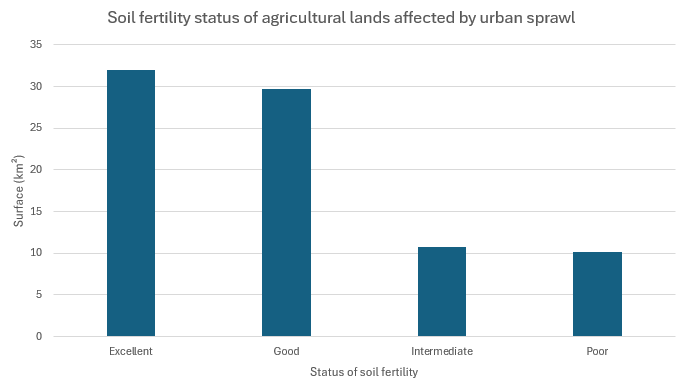
- the area affected by the urban sprawl according to the soil fertility status.
Expected results
Expected chart (with Excel)
4. Dataset
The dataset can be downloaded here .
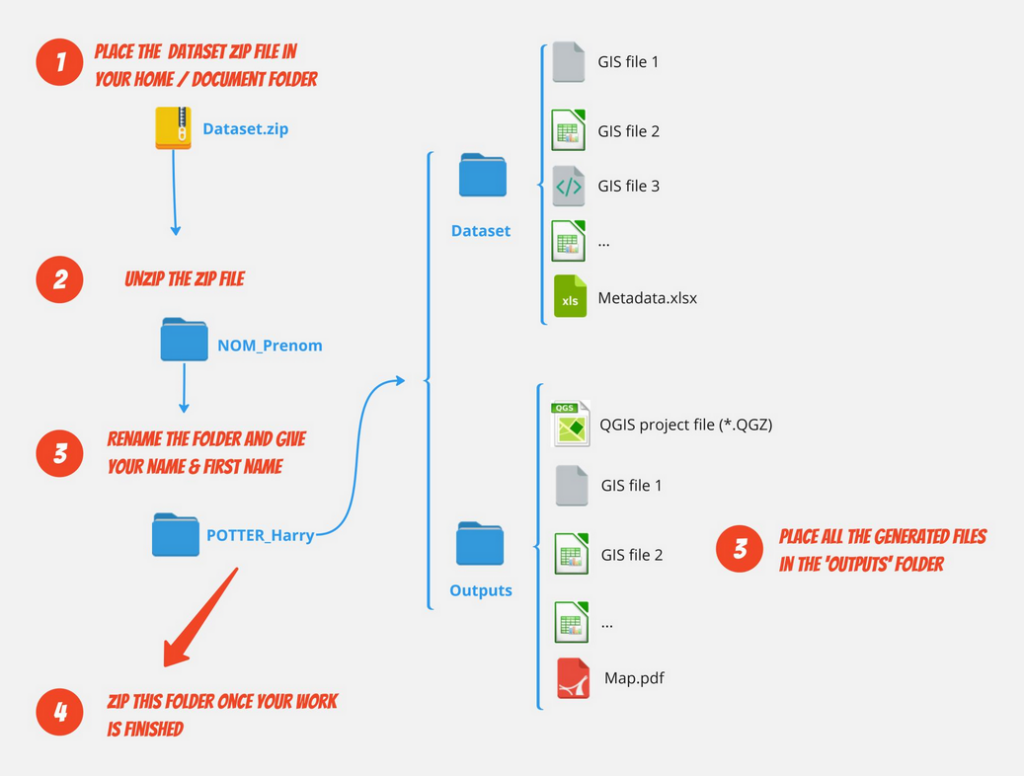
Follow the guidelines below to organise your dataset. All the generated files must be placed in the ‘Output‘ folder.
a. Focus on the dataset
Landcover is derived from Corine Land Cover program which inventories the land cover in 44 classes over the EU countries.
The land cover has been determined through analysis of satellite imagery. Several updates have been performed: 1990, 2000, 2006, 2012, and 2018. The Minimum Mapping Unit (MMU) is 25 hectares (ha).
The soil fertility status is assessed by the amount of plant available water of the soil (in French: Réservoir en eau utilisable par les cultures).
b. Metadata
Please fill the Excel file ‘Metadata.XLSX‘ stored in the dataset. You may find information by accessing the QGIS documentation .
5. Spatial analysis
Step 1: Adjust the dataset to the AOI extent
Step 2: Extract agricultural lands affected by urban sprawl
Step 3: Calculate the urban sprawl per metropolitan area
Step 4: Assess the status of soil fertility affected by urban sprawl
6. Design the map layout
Share your work on Moodle
Save your QGIS project, close QGIS, ZIP your work folder and post your work on Moodle.
7. Conclusion
Based on satelite imagery, this exercise aims at visualizing and calculating the rate of urban sprawl in the Oise district. For instance, the calculation from 1990 to 2018 is as follows. On the whole period, 88,9 km² of agricultural lands were artificialized. The daily rate of urban sprawl in this context was: 66 / (365 x (2018 – 1990) = 0.008 km² (0.8 ha) / day.
The soils affected by the urban sprawl are especially soils with good and excellent fertility status.