1. About this exercise
NB: This exercise is obsolete. It has been updated and is available at this address.
- GIS expertise: intermediate
- Duration: 3 hours
- GIS software: QGIS 3.40
- Consult this section to switch to English language interface.
- Last update: 30/07/2025
- Requested tools or skills :
- Selection of features by two ways:
- By attributes
- By location
- Clip shapefiles
- Dissolve features
- Design layout of the map
- Selection of features by two ways:
- Elements of vocabulary:
- Area of Interest (AOI) : zone d’études
- Plots: parcelle agricole
- Watershed: bassin versant
2. Context
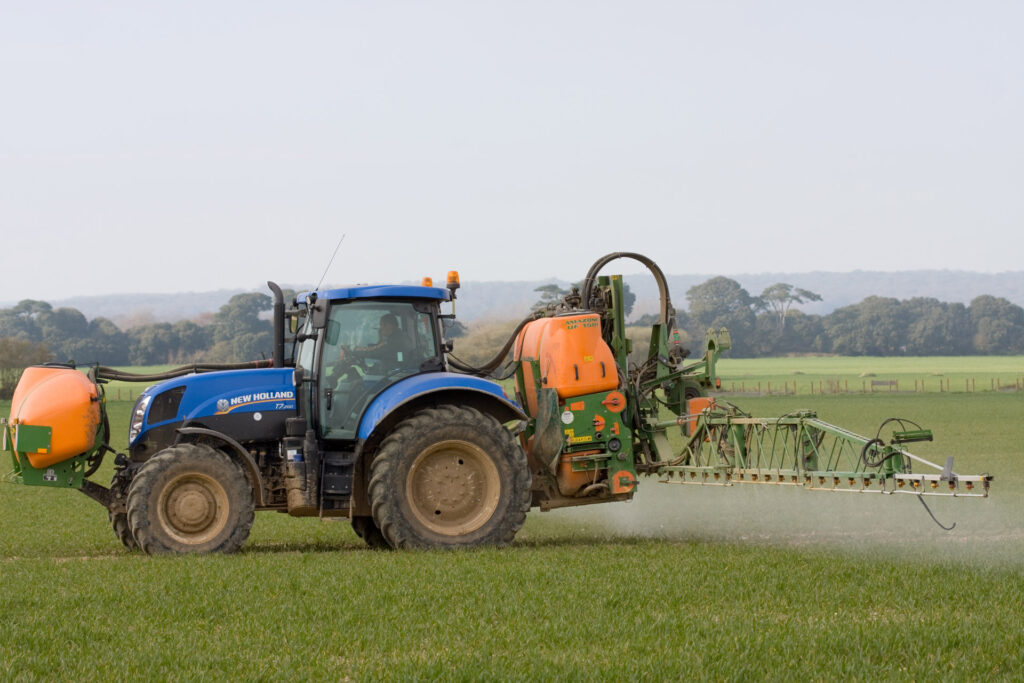
You are asked to identify the agricultural plots which are close enough to the river network. Hence, they may contribute to water pollution due to agricultural contaminants (e.g. fertilizers or pesticides). This work will be useful to promote best agricultural practices in order to mitigate the transfer of contaminants to the environment.
About diffuse contamination
The diffuse contamination refers to the release of potential pollutants from a range of activities that, individually, may have no effect on the water environment, but, at the scale of a watershed, can have a significant effect. (SEPA , 2019).
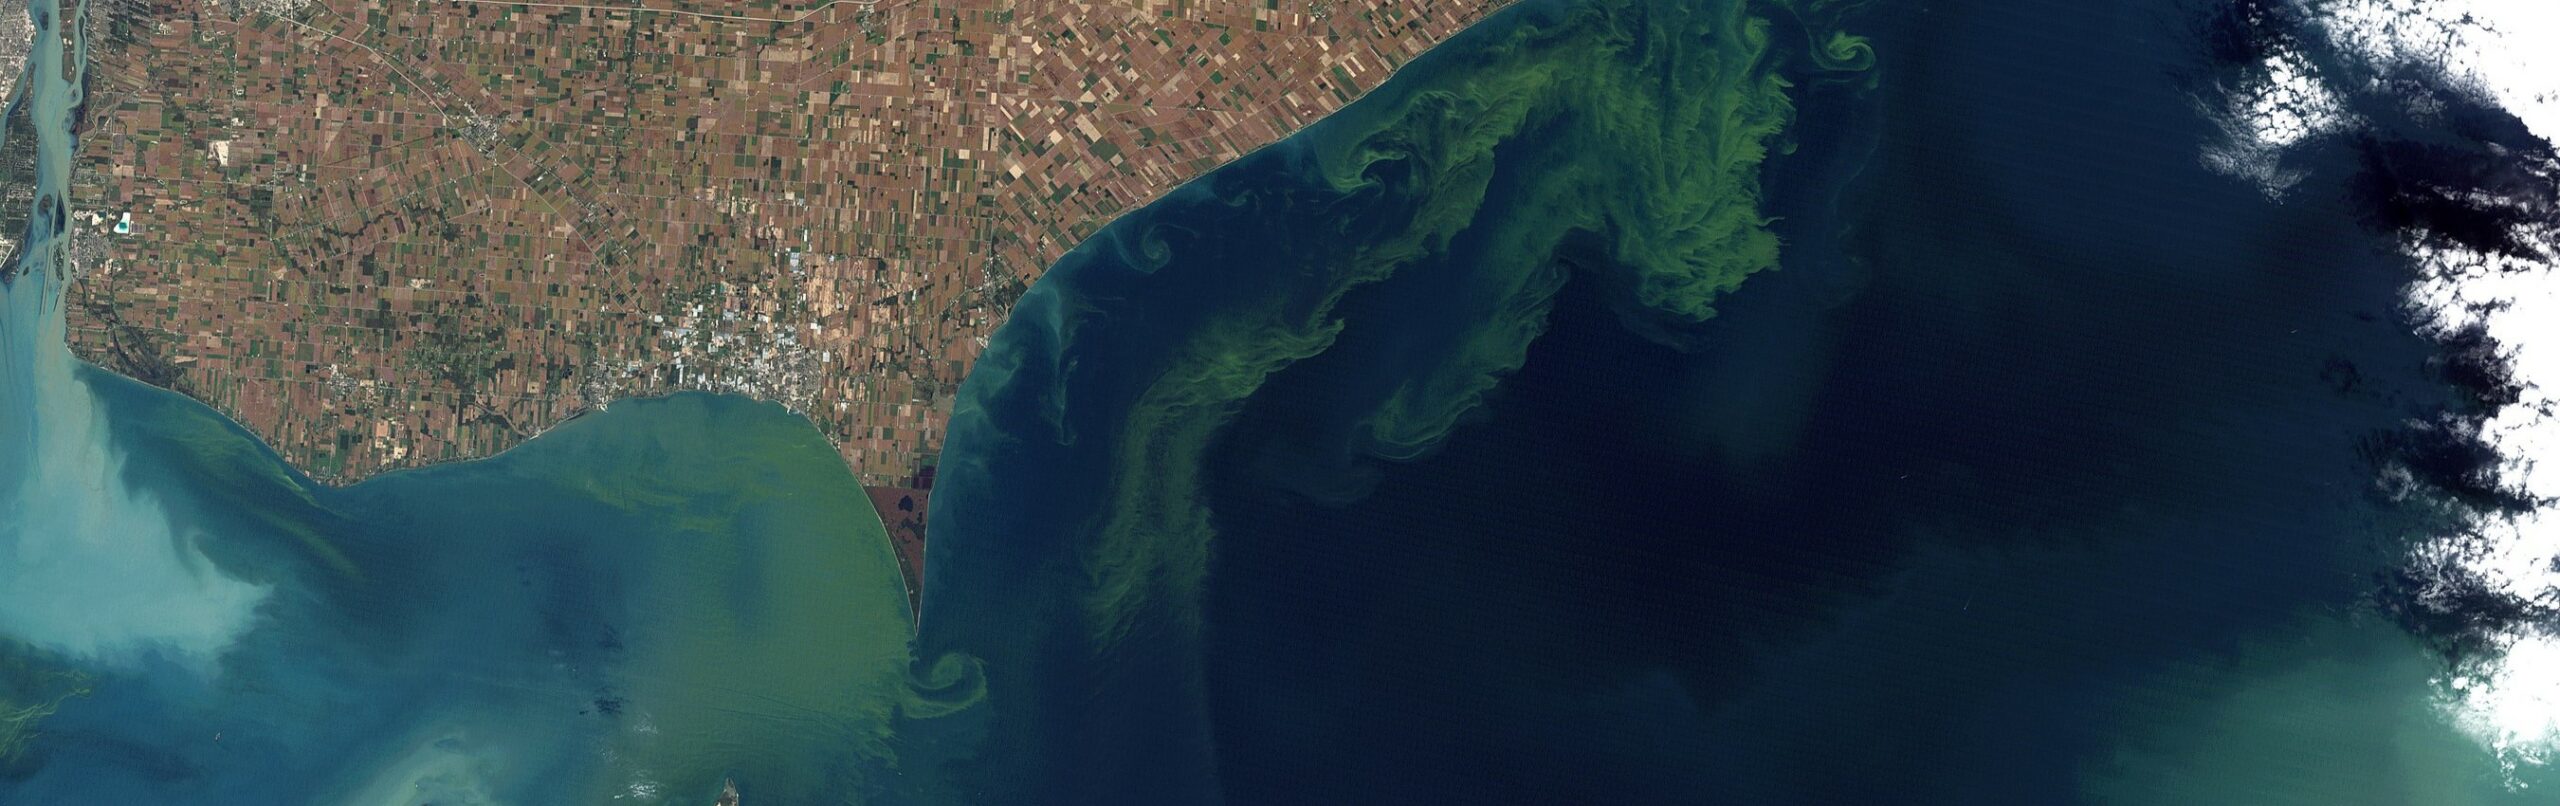
The fertilizers and pesticides spread on the agricultural plots may reach the water bodies (rivers, lakes, aquifers) and affect the water quality status. High concentration of fertilizers leads to eutrophication and algal bloom (cf. introductive picture).
3. Instructions
Design a map layout presenting the following features:
- the plots located at max. 200m of the rivers and which are cropped with wheat,
- the area of interest (AOI) is “Le Thérain” sub-watershed, located in the Seine watershed,
- the river network flowing inside the AOI,
- the OpenStreetMap basemap,
- a small frame displaying the AOI extent within the Seine watershed,
- the usual map layout (scale bar, North arrow, etc.)
Export the map in PDF
a. Expected results
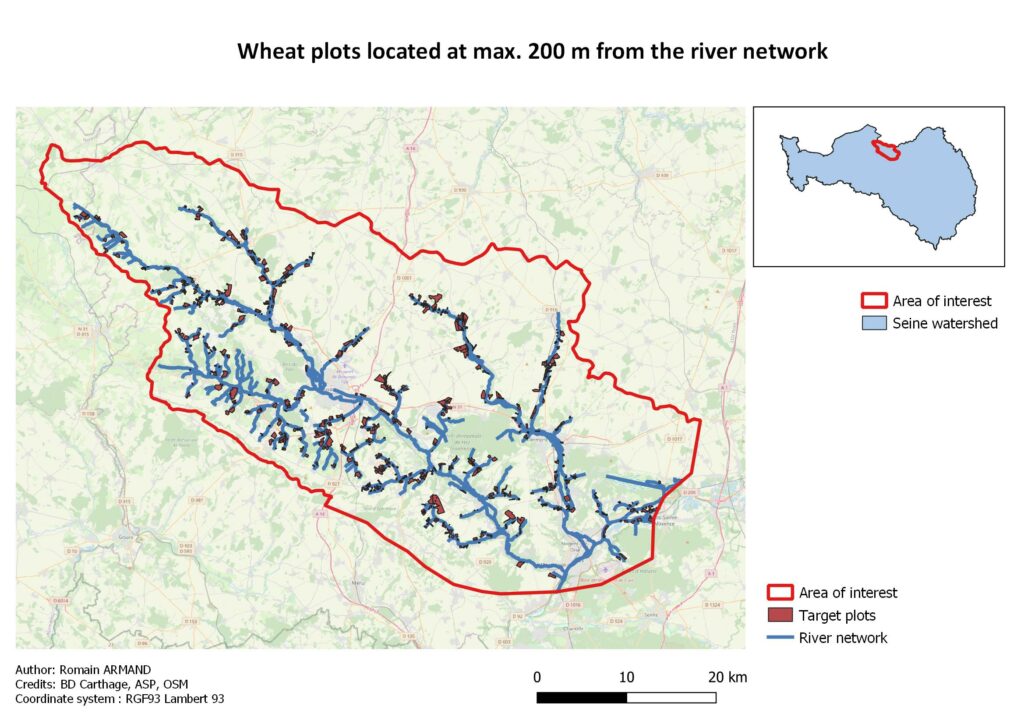
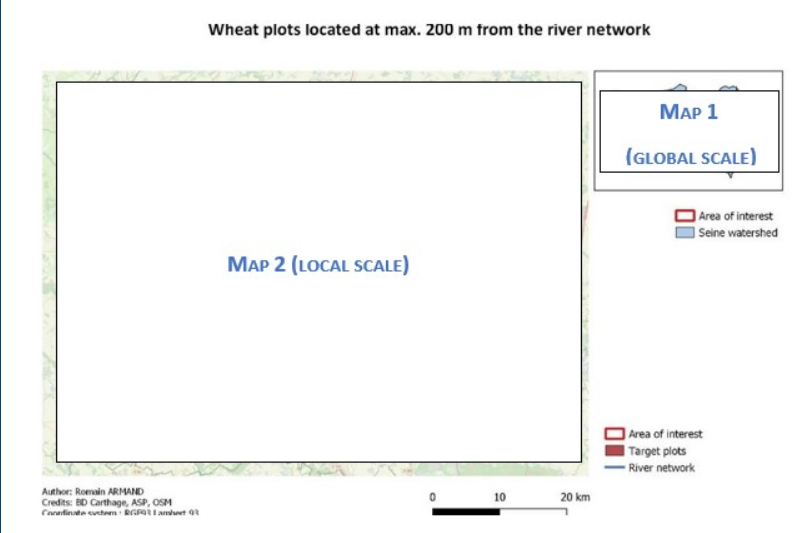
b. About the final map layout
The small map (global scale) will be realized in first, then the detailed map (local scale).
4. Dataset
a. Download the dataset
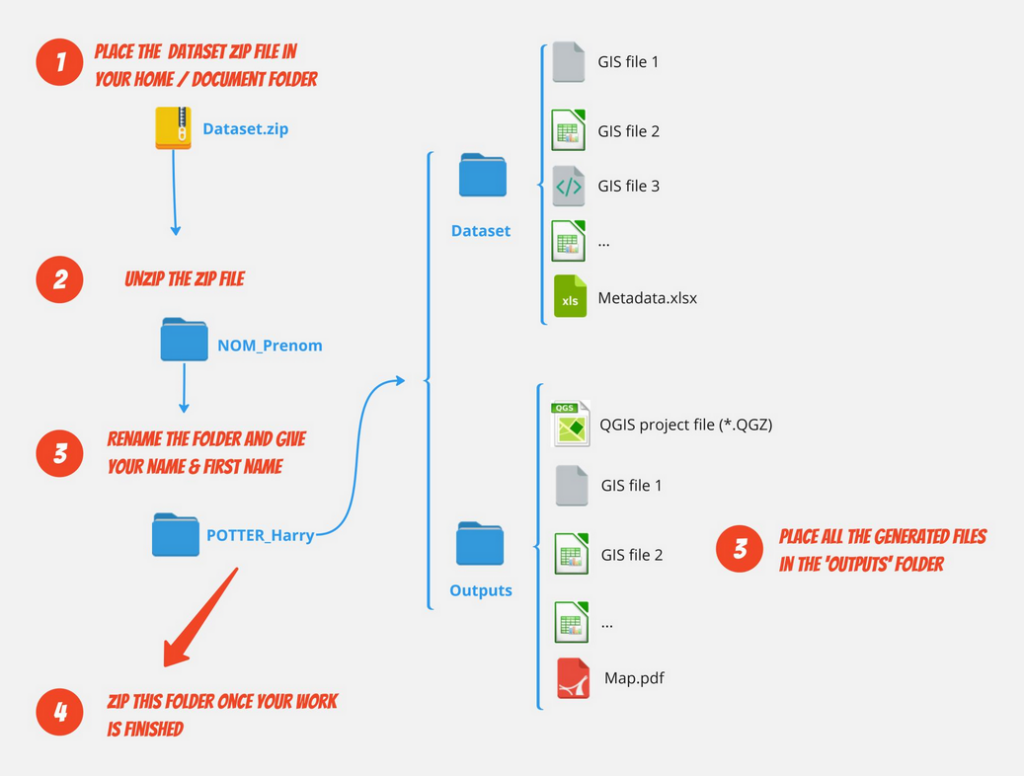
The dataset is available here . Paste the ZIP file in your personnal folder and unzip it.
Follow the guidelines below to organise your dataset. All the generated files must be placed in the ‘Output‘ folder.
b. Metadata review
Please fill the ‘metadata.XLSX’ Excel file (stored within the dataset).
You may find information by accessing the QGIS documentation .
5. Spatial analysis
Step 1: Design the global map (map 1)
Step 2: Clip the dataset to the AOI extent
Step 3: Select the wheat plots
Step 4: Select the plots close to the river network
6. Design the map layout
7. To go further
In France, some water ways are required to be protected by buffer strips. These buffer strips are strips of grassy vegetation of at least 5m in width. Their role is to slow down the water runoff and hopefully catch contaminants before they reach the waterway.
You can find the protected waterways for the AOI here .
All the waterways protected by BCAE 4 measures are available for download here .