1. About this exercise
- GIS expertise: intermediate
- Duration: 3 hours
- GIS software: QGIS 3.34
- Consult this section to switch QGIS interface to English language.
- Last update: 03/02/2025
- Author: Romain Armand
- Requested tools or skills :
- Topographical tools (slope, isolines, flow accumulation)
- Raster calculator
- Atlas (in map layout)
2. Context and definitions
a. Context
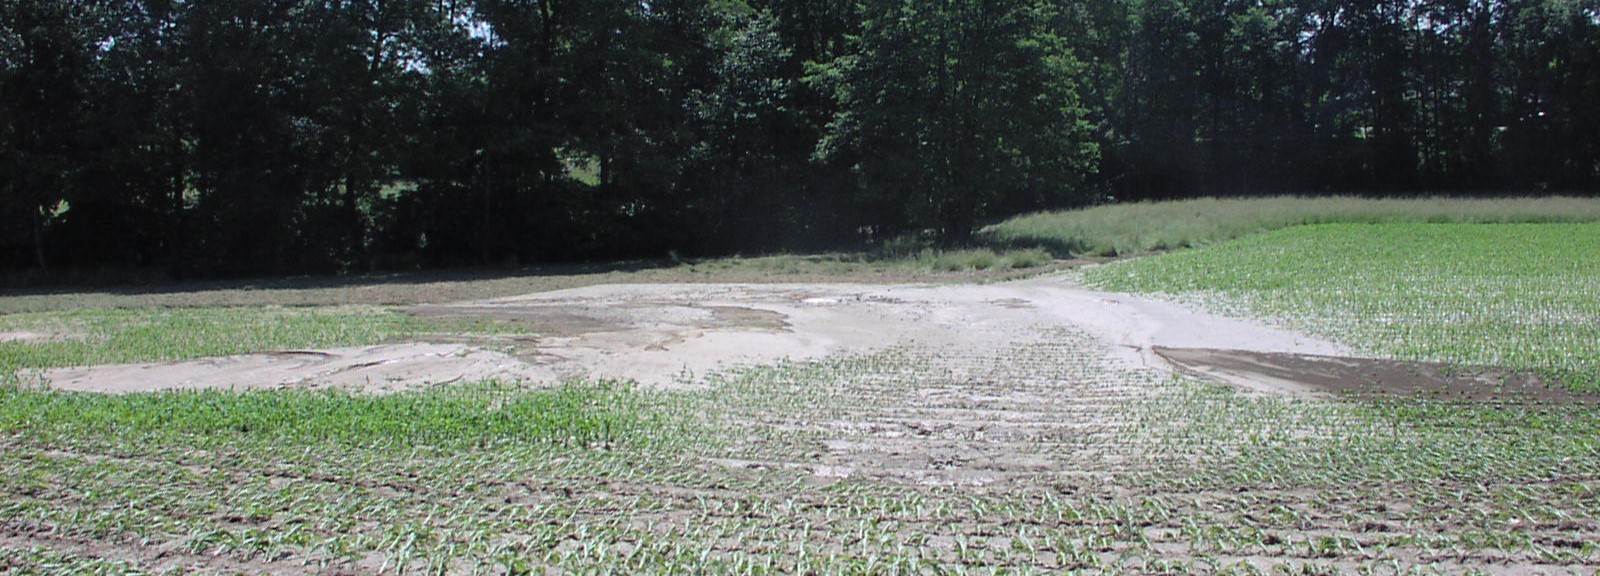
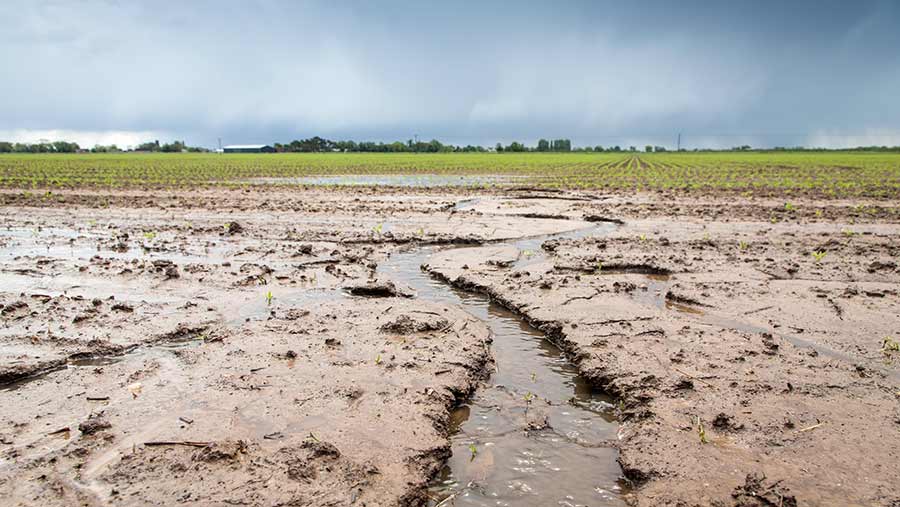
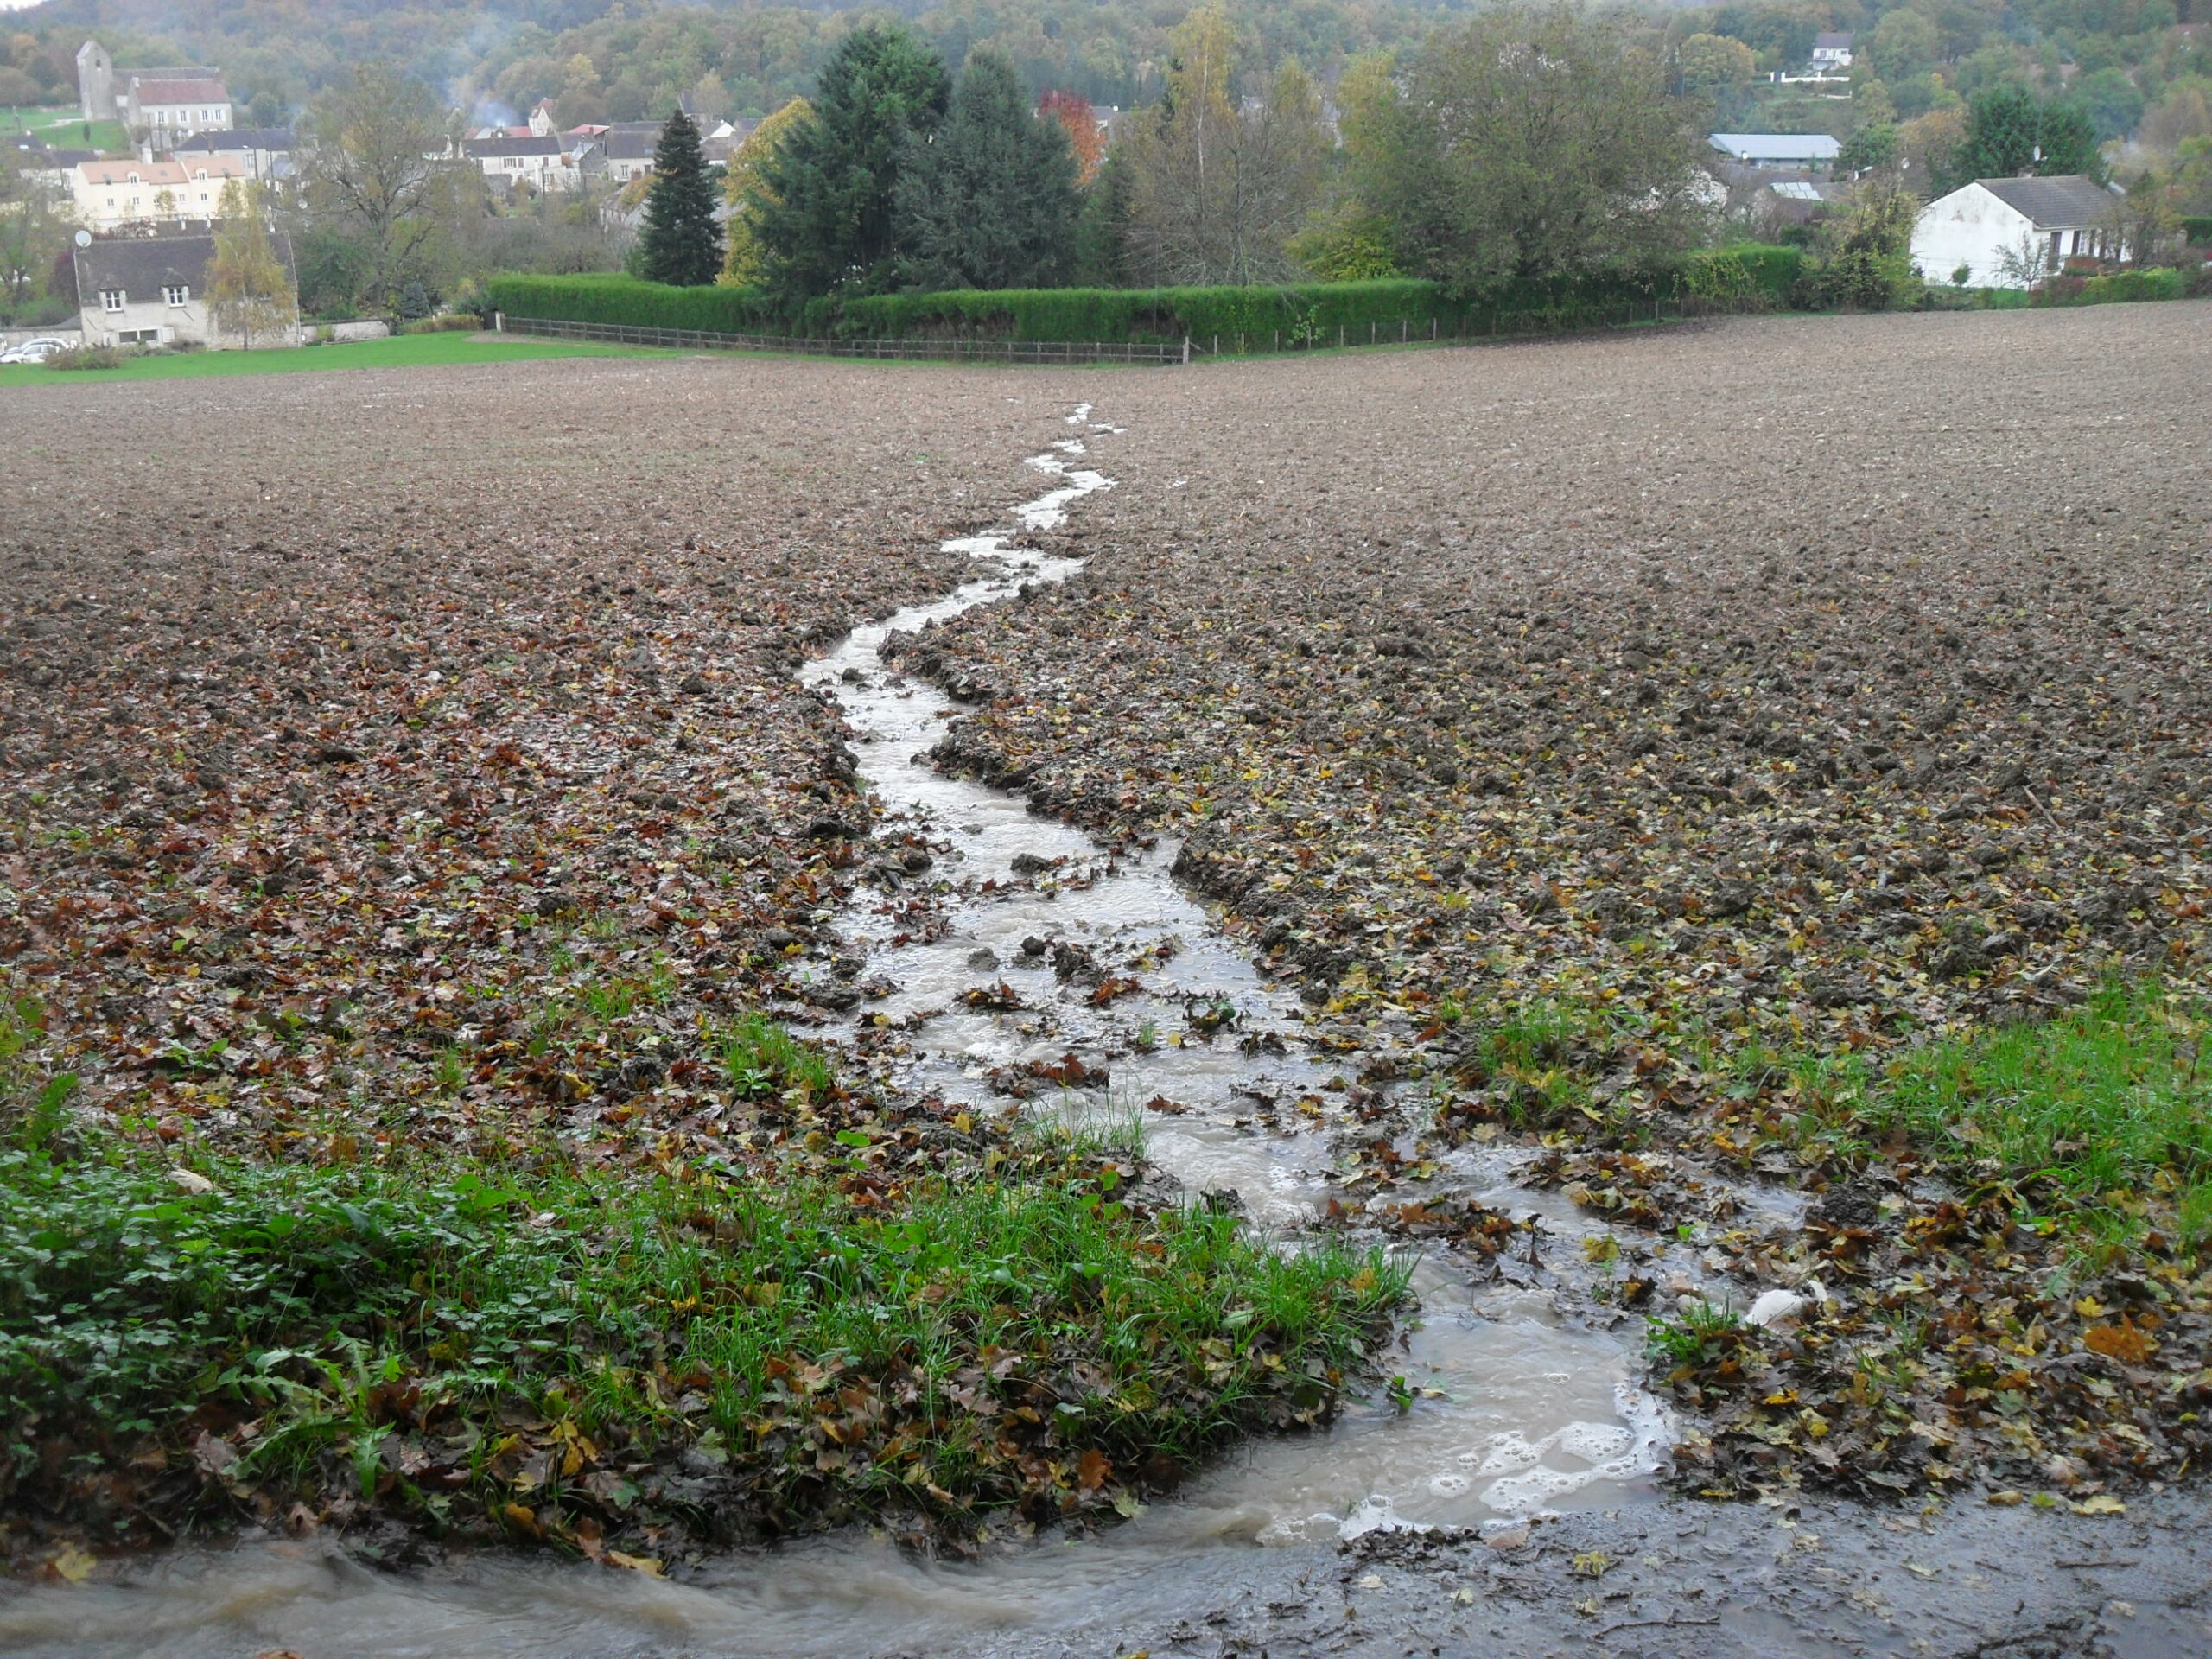
Erosion corresponds to a structural degradation of both soil surface and soil profile. Several factors triggers soil erosion such as soil texture, terrain slope, soil cover, farming practices or rainfall intensity. Soil erosion affect several soil functions (e.g. biomass production, flood regulation) and may degrade the water bodies located downstream such as lakes and rivers by transporting large quantities of sediments and agricultural contaminants. It can also contribute to muddy floods*.
b. Definitions
- Mitigation (atténuation): in the context of mitigating muddy floods, « mitigation » refers to the actions taken to reduce the severity, impact, or likelihood of such floods (soil conservation, reservoirs, land use planninng).
- Plot (champ): in the context of farming, a plot refers to a defined area of land designated for agricultural use. It is a specific portion of a farm or field where crops are cultivated, or livestock is raised
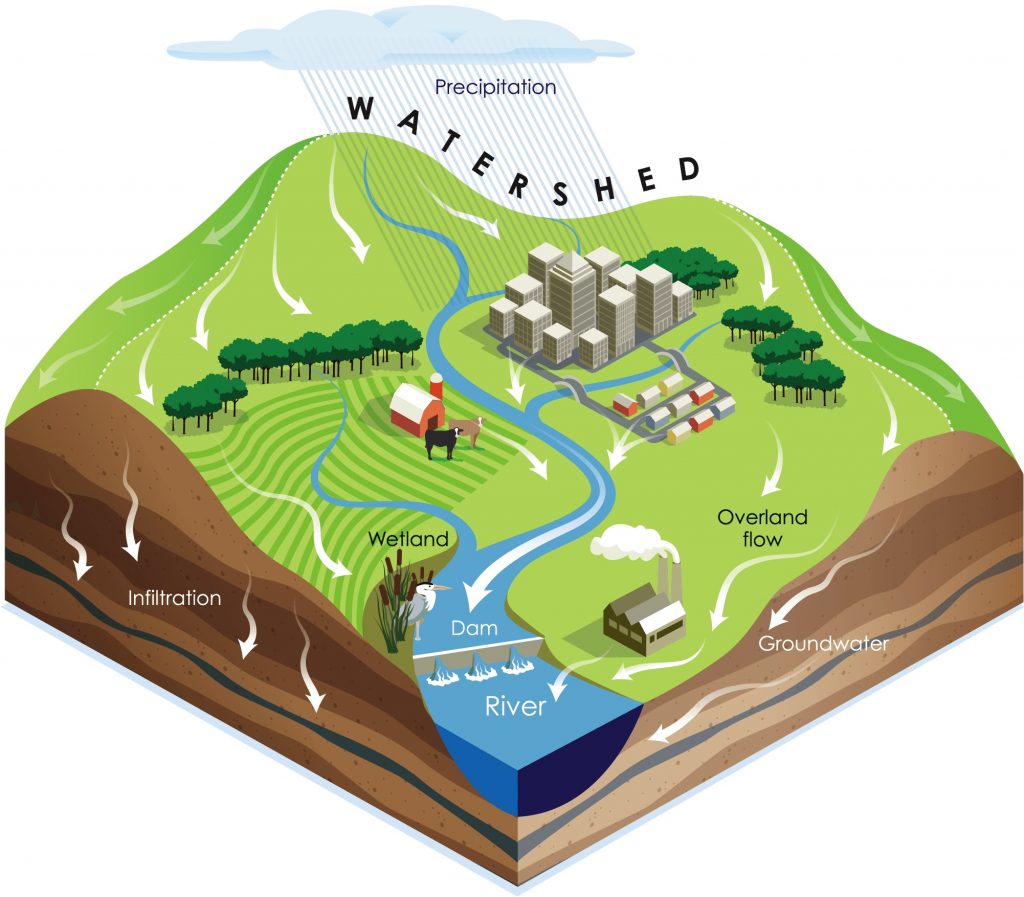
- Upland (amont): in hydrology, the term « upland » refers to higher elevation areas within a watershed. These areas are typically the source of water that flows downhill into streams, rivers, and other water bodies
- Talweg: a talweg is the line that connects the lowest points along a valley or river. It represents the natural path that water would follow due to gravity, typically forming the course of a stream or river. The term « talweg » comes from the German words « Tal » (meaning « valley ») and « Weg » (meaning « way » or « path »)
- Watershed (bassin versant): a watershed is an area of land that drains water into a particular body of water, such as a river, lake, or ocean. It is defined by the topography of the land, with boundaries determined by the highest points of the terrain that descends into the water body.
3. Objectives
a. Instructions
In charge of soil conservation at the watershed scale, you are expected to locate the farming plots* which are prone to erosion to implement soil mitigation* techniques. Your area of interest (AOI) is the ‘Ru de Berneuil’ watershed which is located a few kilometers at the south of Beauvais (France).
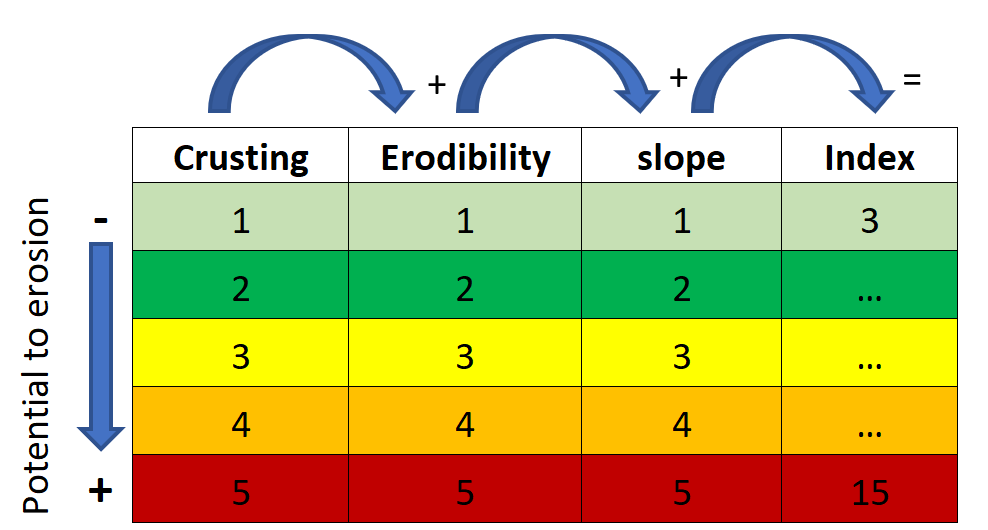
To do so, you are asked to evaluate the soil erosion potential through 3 factors:
- soil crusting: depending on the texture (especially silt content), the soil agregates may form crusts which are quite impermeable;
- soil erodibility: depending on the texture, the soil agregates may not resist to the overland flow on the surface. Hence the soil may be affected by concentrated erosion (e.g.: rills and gullies).
- terrain slope: highest slope values mean that the overland flow will be able to gain velocity and thus could erode the soil surface beneath.
Each factor ranges from 1 (low potential of soil erosion) to 5 (high potential of soil erosion). The index value corresponds to the sum of the 3 factors. This method is inspired from the report L’érosion hydrique des sols en France (2002) by Le Bissonais et al. (PDF).
b. Expected maps
You are asked to design 2 maps:
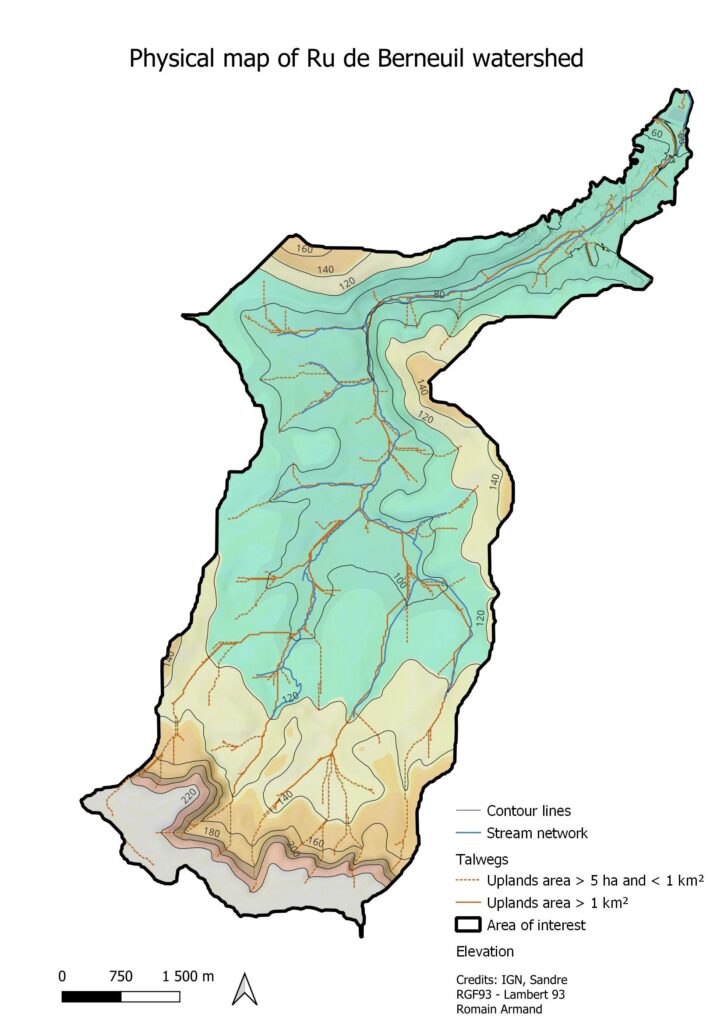
Map 1 is a physical map which displays:
- the elevation
- the contour lines (interval = 20m)
- The stream netwok
- The talwegs* network where runoff comes from:
- upland* areas > 5 ha and < 1 km²
- upland* areas > 1 km²
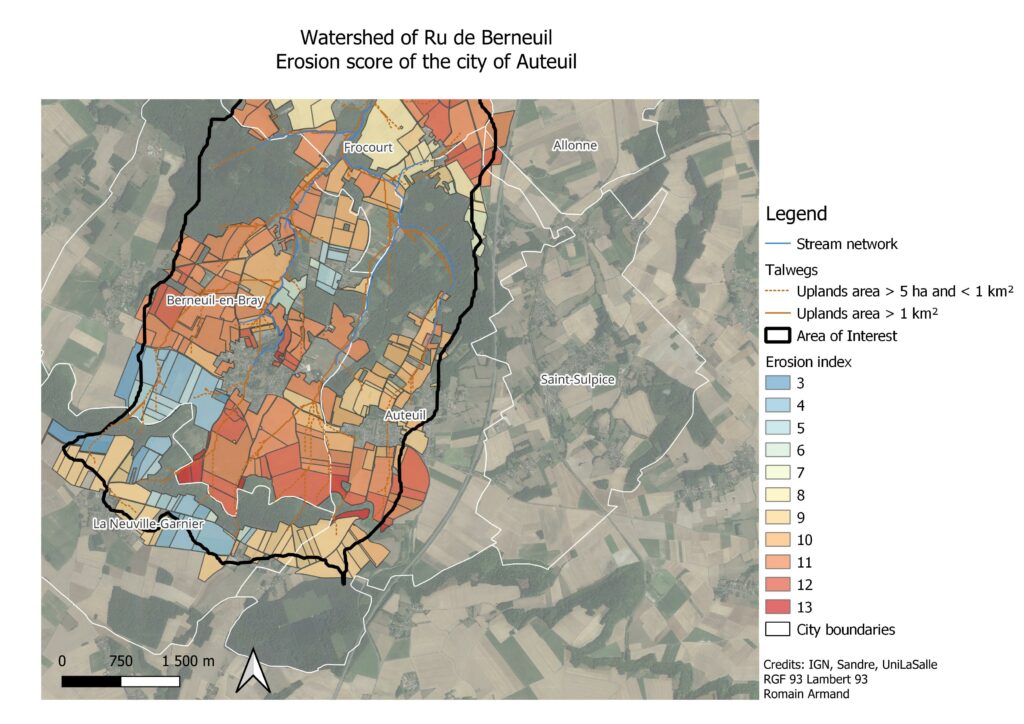
Map 2 uses the atlas QGIS mode to design a template map that will be declined for the all cities enlisted in the dataset (n=8).
4. Dataset
The dataset is available by clicking on this link.
Please review the metadata and fill the Excel file ‘Metadata.xlsx’ available in the dataset.
5. Spatial analysis
a. Calculate the relief and topographic lines
b. Extract the talwegs network
Download the flow accumulation raster file