1. About this exercise
- GIS expertise: intermediate
- Duration : 3 hours
- GIS software: QGIS 3
- Last update: February 2024
- Author: Romain Armand
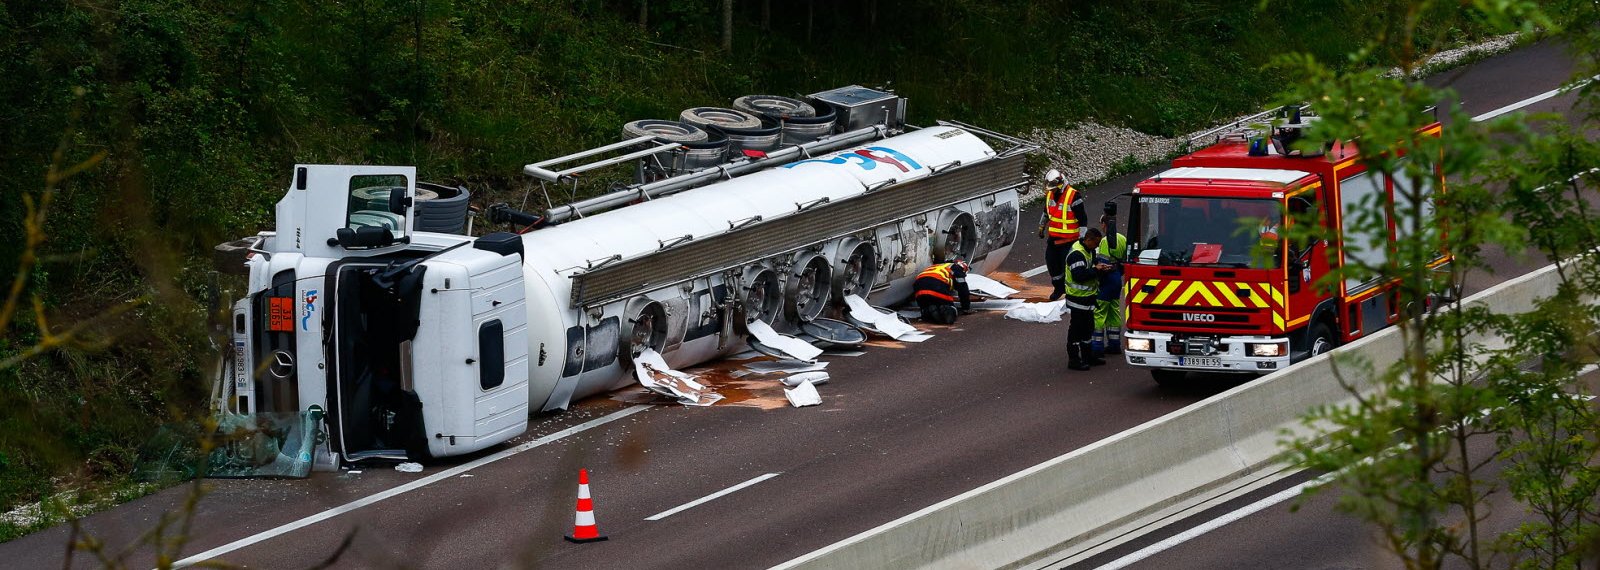
2. Context
A lot of human activities depend on groundwater (drinking water, crop irrigation, power supply, industry). However, groundwater is susceptible to pollutants. Groundwater contamination occurs when man-made products such as chemicals and fertilizers get into the groundwater and cause it to become unsafe and unfit for human use.
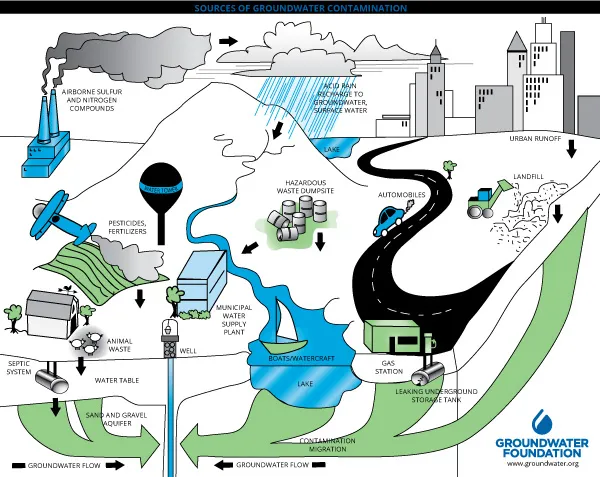
Drinking contaminated groundwater can have serious health effects. Diseases such as hepatitis and dysentery may be caused by contamination from septic tank waste. Poisoning may be caused by toxins that have leached into well water supplies. Wildlife can also be harmed by contaminated groundwater. Other long term effects such as certain types of cancer may also result from exposure to polluted water [Groundwater Foundation].
3. Instructions
In charge of management of hazardous materials transportation, you are asked to identify the roads that could be possible ways of accidental aquifer contamination. This identification will be based on 2 factors:
- the permeability status of the geological formations below the soil surface controlling the speed of the contamination process to the groundwater.
- the presence of an aquifer below the ground surface.
To reduce computing time, you are supposed to only work on Highway and National roads.
You are asked to:
- Fill the metadata table (Excel file),
- Design a map containing :
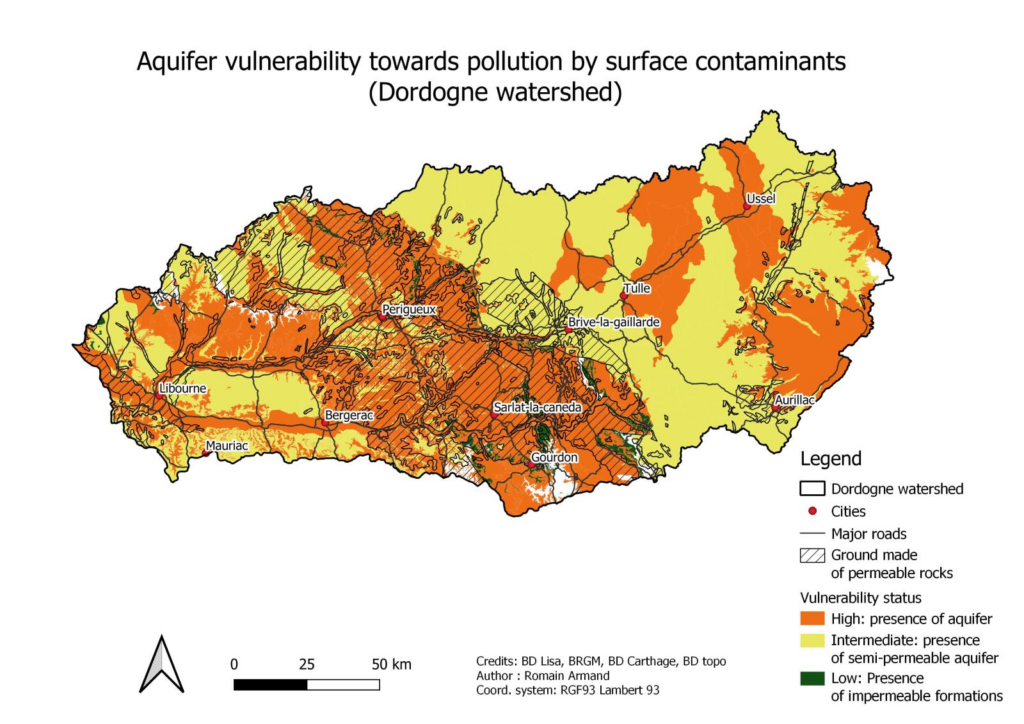
- the area of interest (AOI) which is “La Dordogne” watershed,
- display the geological formations which high potential of permeability,
- display the 3 types of hydrogeological formations (aquifer, semi-permeable aquifer, impermeable formation),
- display the main cities located in the AOI,
- design the usual map layout (scale bar, North arrow, etc.)
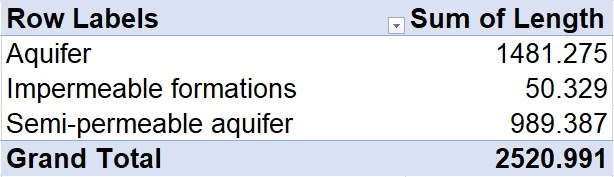
- Calculate the total road length per hydrogeological formations (aquifer, semi-permeable aquifer, impermeable formation). The results will be exported to an Excel file (specific calculations can be run in Excel).
- Share your work on UniLaSalle academic platform (Moodle).
Data management
All the output files and the QGIS project (created when you saved the project) should be located in the same folder.
Expected results
4. Working environment
a. Dataset download
The dataset can be downloaded here.
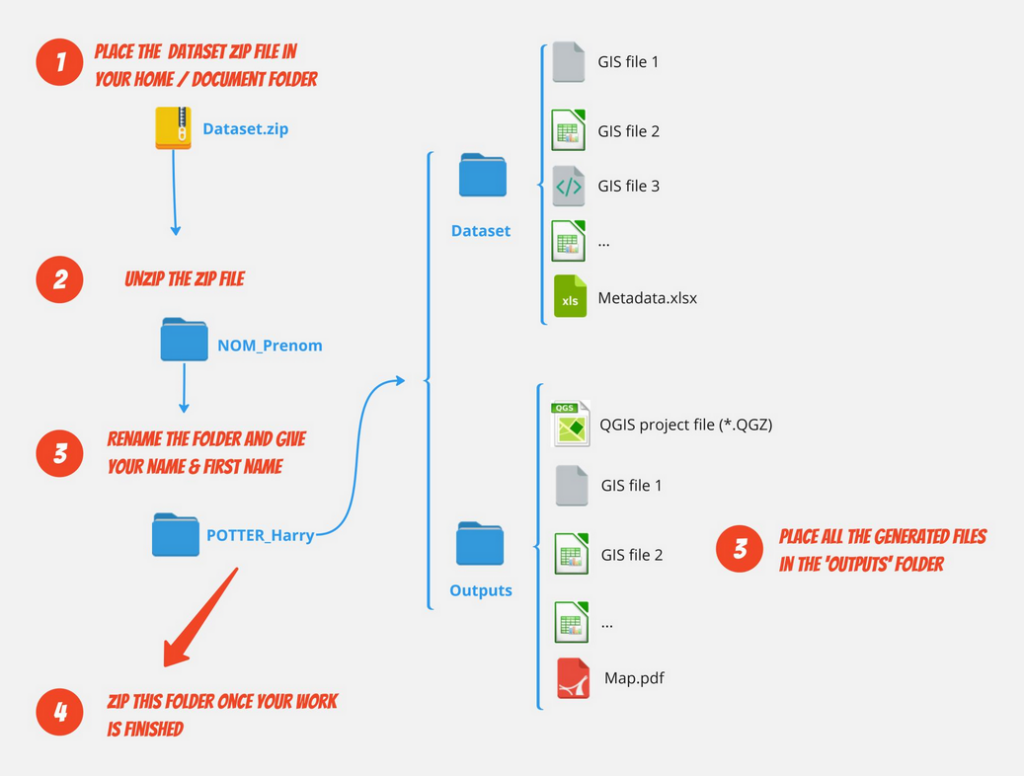
Follow the guidelines below to organise your dataset. All the generated files must be placed in the ‘Output‘ folder.
b. Metadata
Please fill the Excel file ‘Metadata.XLSX‘ stored in the dataset. You may find information by accessing the QGIS documentation.
5. Spatial analysis
Step 1 – Extract the AOI and adjust the dataset to the AOI limits
Step 2 – Extract permeable rocks
Step 3 – Identify hydrogeological formation per road
6. Design the map layout
7. Share your work
Once you’ve finished your work, follow the following steps to share your work to your instructor:
- Save the QGIS project
- Close QGIS and Excel
- ZIP your Last_Name_First_Name folder (how to?)
- Upload your work on Moodle
Congratulations!